Cycling Statistics
I joined Strava in August of 2011 and have been using it ever since. I don't dig into the numbers much, nor do I ride with any particular goals. Cycling is mainly a way to stay in shape, enjoy the outdoors and have fun. Strava just offers a social connection with like-minded athletes all over the world. It's a great way to stay in touch with people I've ridden and a great place to make new connections. Besides the social aspect of the site, it's also a great activity journal. Based on the data Strava collects, I've maintained the following separate cycling statistics:
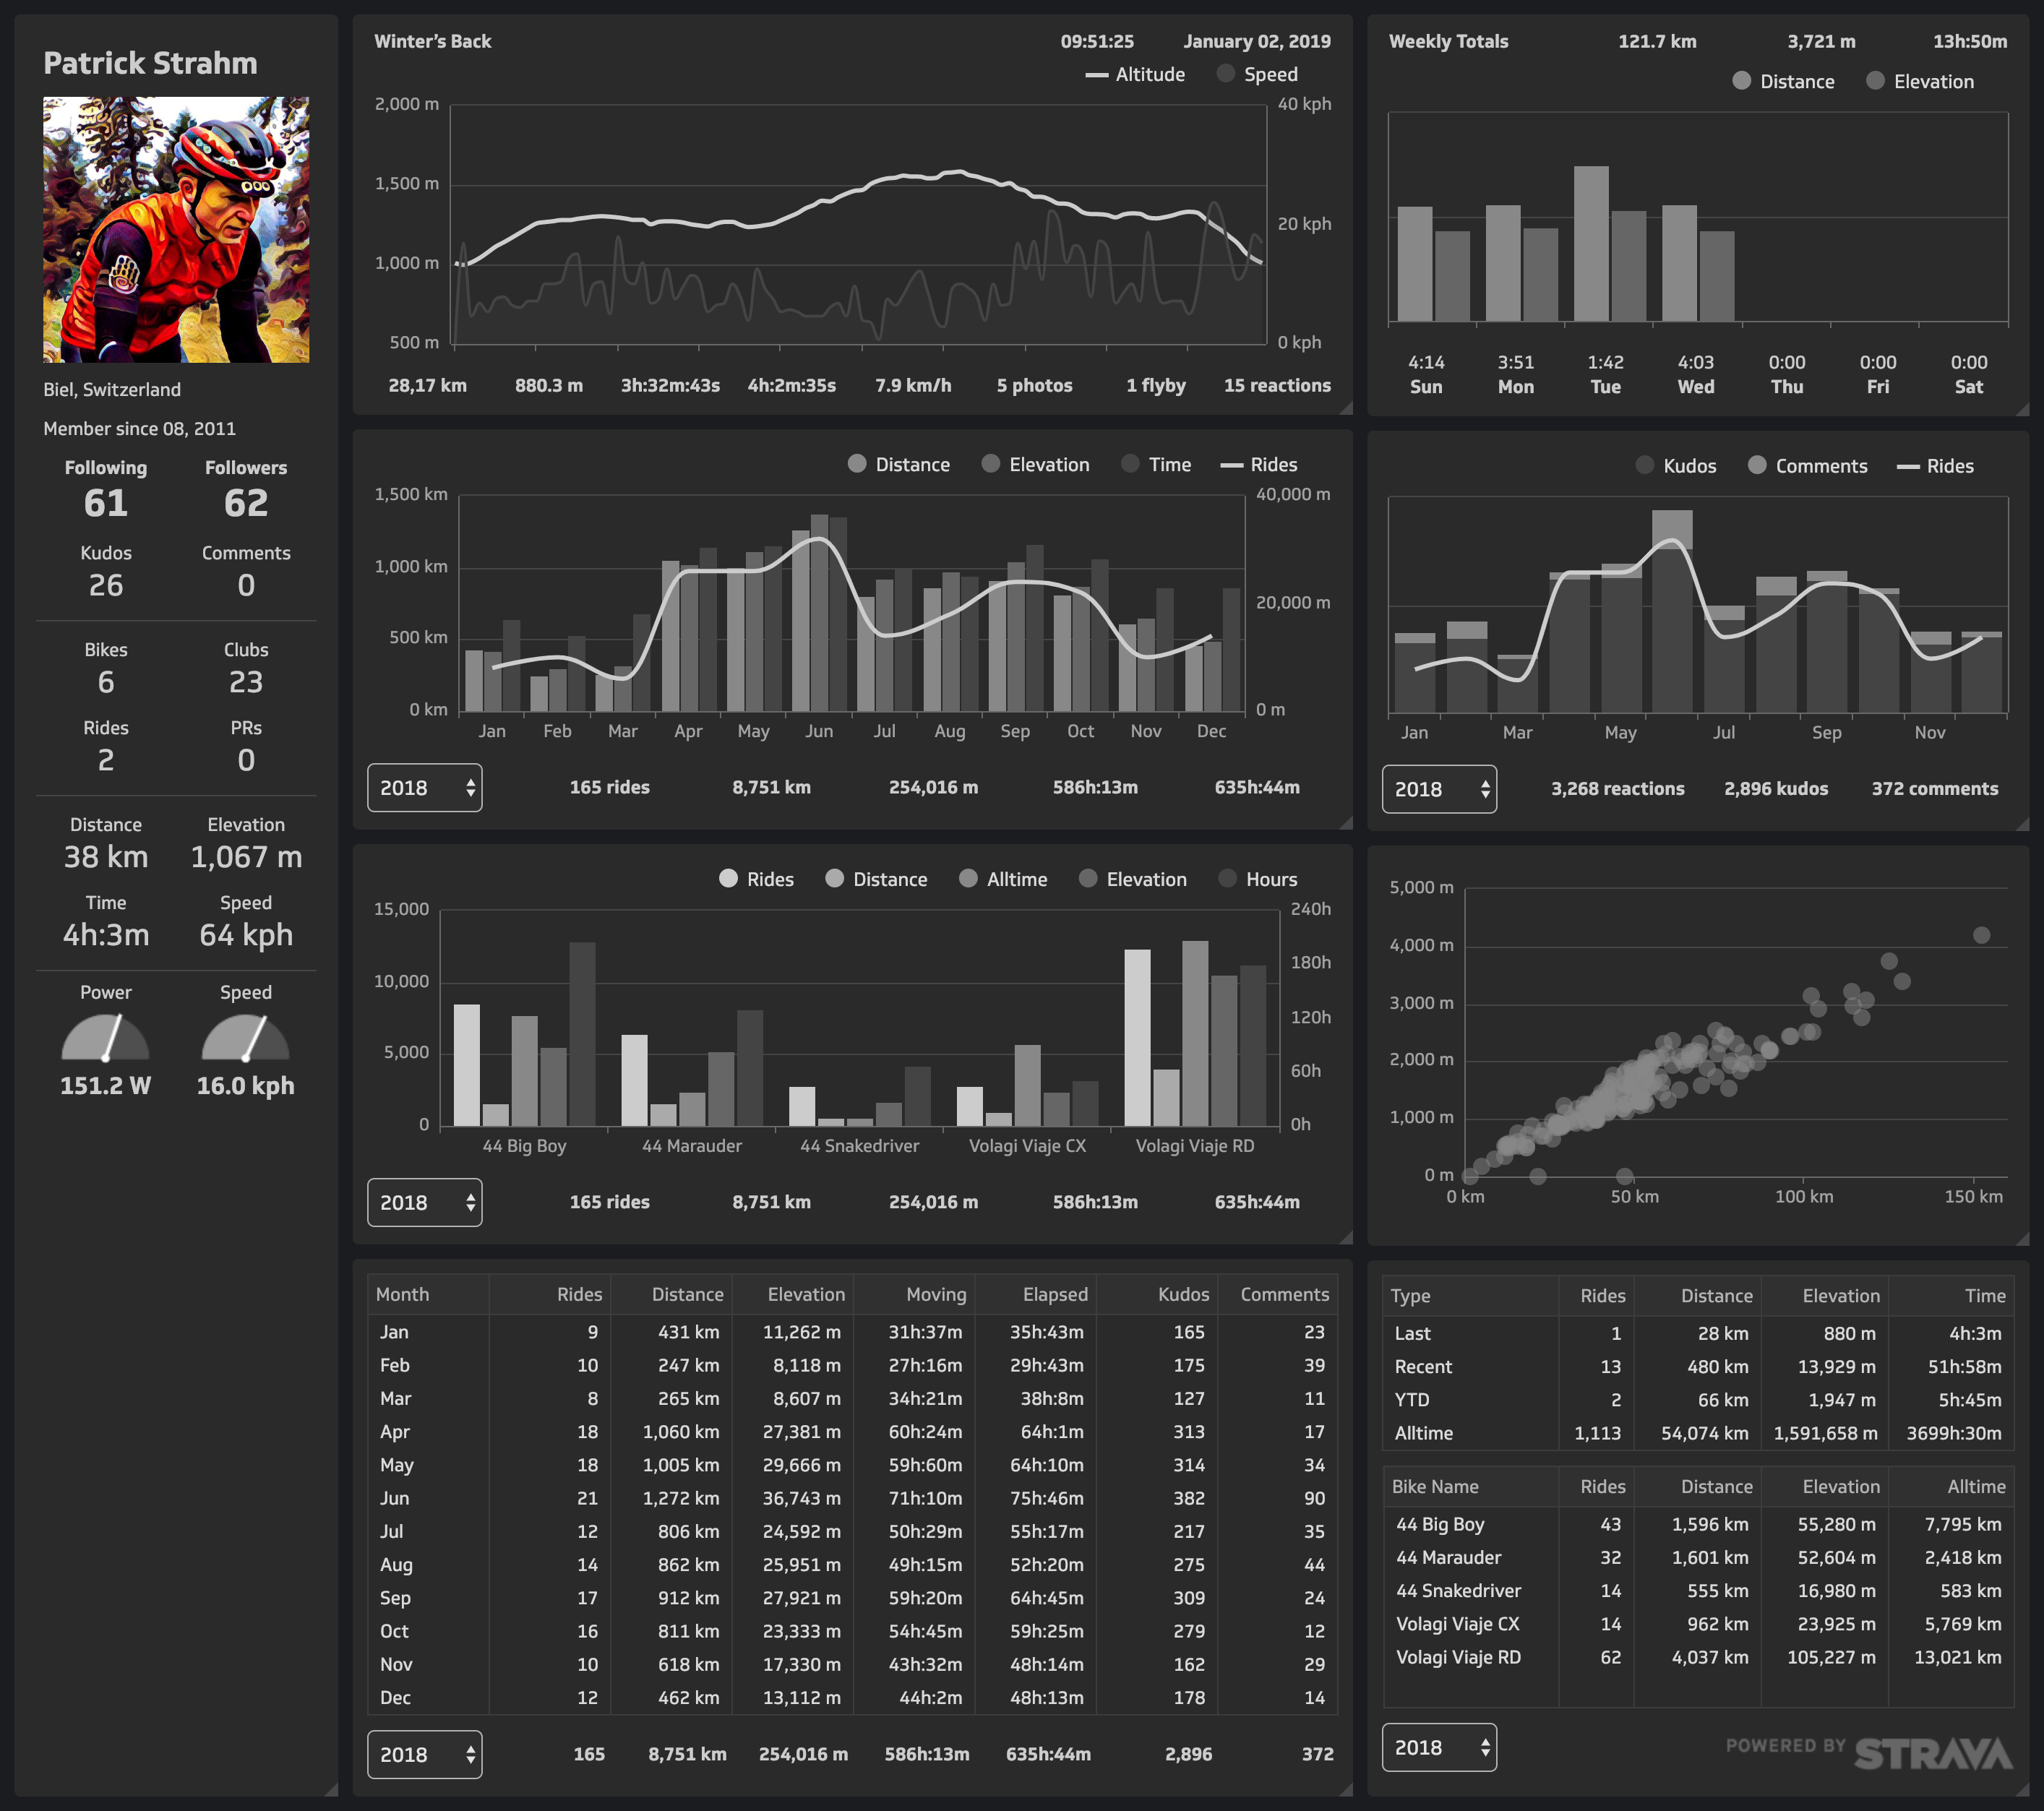
- Bike Statistics: Yearly distance ridden, elevation climbed, hours ridden and number of rides grouped by bike used.
- Yearly Statistics: Monthly distance ridden, elevation climbed, hours ridden and number of rides since 2012.
- Two Year Comparison Statistics: Distance and time comparison between two years starting from 2012.
- Ride Type Statistics: Number of rides between 2012 and the present based on type of ride (road, cross, mountain, fat).
Strava gives you a bunch of data, but not everything. Personally, I like to have an idea how often I use a specific bike and how many miles I ride with it during the course of the year. Strava has that data, but unfortunately doesn't present it to you. I spent a couple of hours with Klipfolio and whipped up a dashboard for myself.

Screenshot, since the dashboard was accessible to nobody but me. Sadly, Klipfolio sunsetted the freemium accounts at the end of April 2019 and their basic account package is $49 a month. It was a great tool to have, but their pricing is definitely geared towards business users.
Comments