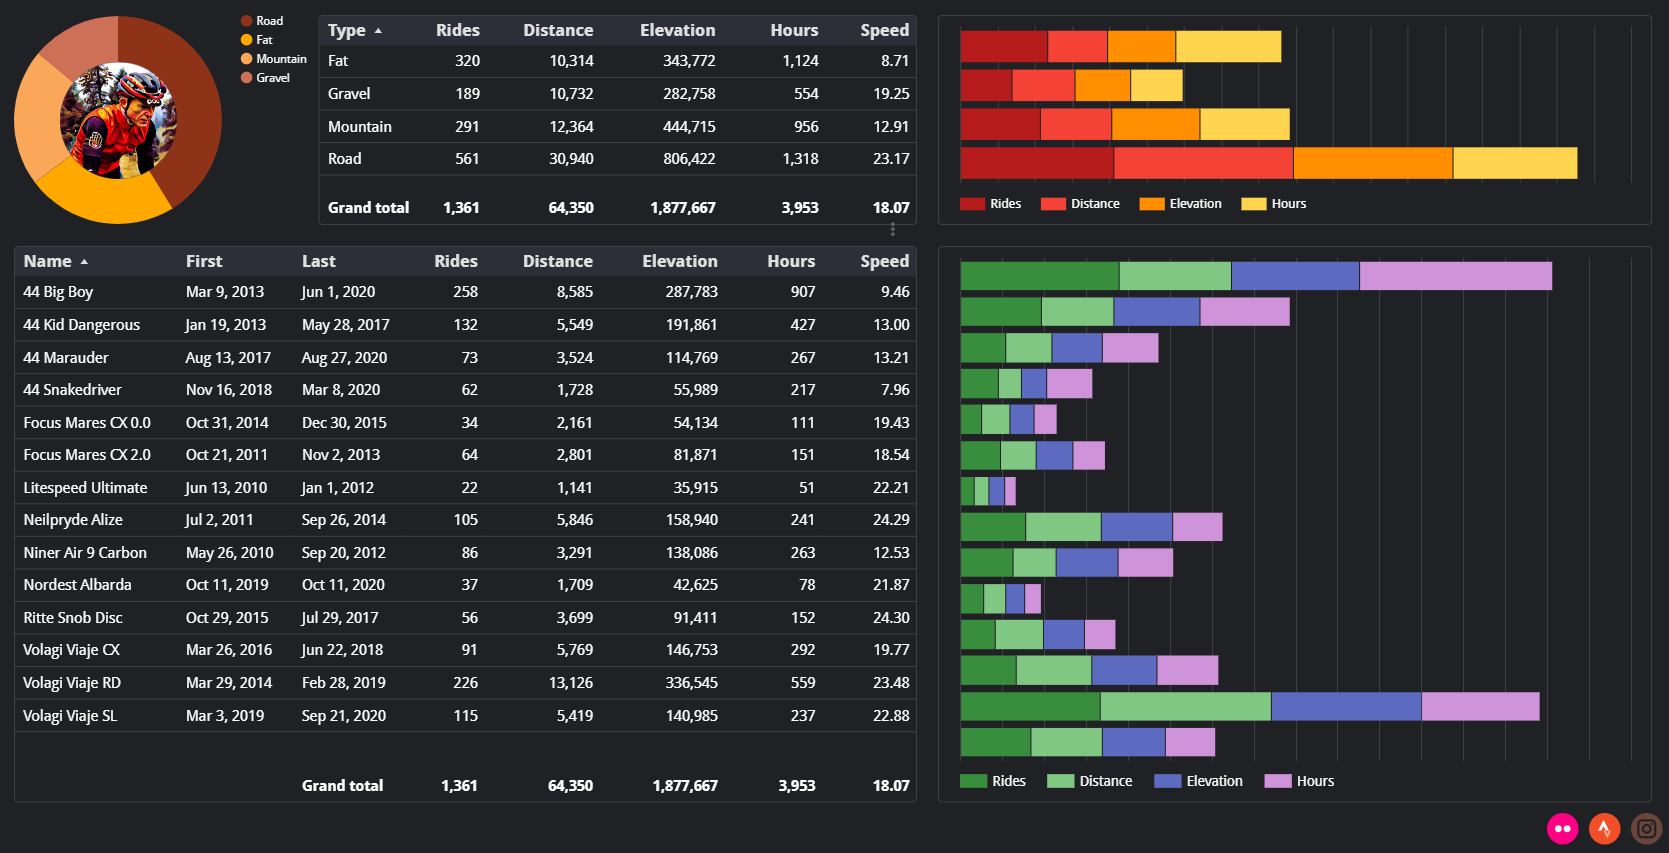
Klipfolio - Strava dashboard.

statistics (10)

Patrick

Some Silly Strava Stats

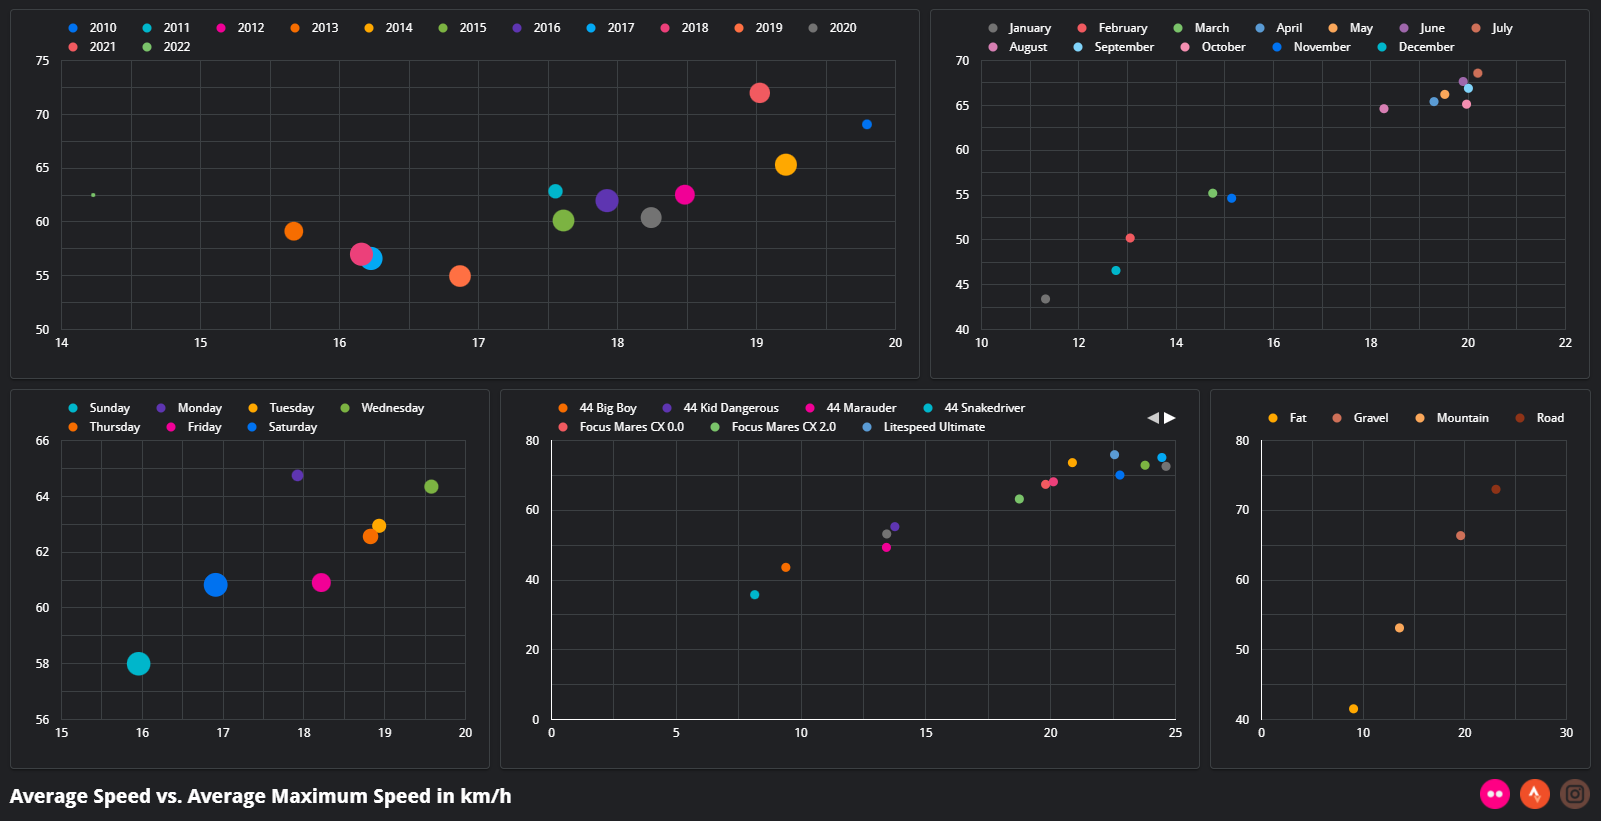
Scatter charts in Data Studio.

As mentioned in my previous post, I recreated my Data Studio dashboard under a new Gmail account because Google’s G Suite legacy free edition, which became Google Workspace in 2020, will require a paid subscription this year. Three simple things needed to be done. First, I had to copy my Google sheet from the old account to my new account. Then, I had to create a new Zapier account, and share my zap from the old account with the new account. This was straightforward. Once logged into Zapier with my new account, I had to link the zap to my Strava account and also had to give the zap permission to modify my Google sheet. Pretty much the same procedure was necessary for the Data Studio report. I logged into the old account and shared the report with my new account. Then, I logged into the new account and had to replace the data sources to point to the Google sheet in my new Gmail account. Sounds complicated but was extremely simple.

Continue reading...

Patrick

Year 2020 In Review

The snow ghosts at the Chasseral.

In 2020 I rode 135 times or 300 hours, totaling 5’195 kilometers and climbing 144’439 meters. Due to our move in 2019, which saw my riding time greatly reduced for the second part of the year, I hoped to get back to a 2018 level in 2020. But that wasn’t possible. The pandemic had little to do with it. We had a few months with short time at work, which would have given me more time to ride. However, in early 2020 one of our cats was diagnosed with chronic kidney disease and her sister shows signs of it, too.

Continue reading...
Patrick

Strava Dashboard in Data Studio

Strava dashboard in Google's Data Studio.

For some time I've been using flink.run to log my cycling activities in a Google sheet. I kept a bunch of stats in that Google document and then every so often manually updated the stats here. Nicolas Zimmer, the creator of flink.run, decided with a heavy heart to shut down his service. As his small side project became more popular it started to take away lots of his personal time and cost him money; hundreds of dollars per month. Time being a scarce resource, he decided it was time to pull the plug.

In order to continue populating my Google sheet with new activities I turned to Zapier, which can do the same thing, though it won't add any past activities, which flink.run could do for you. With my stats in that Google sheet staying up to date, I dove into Google's Data Studio to create a visual report of all my Strava cycling activities. After a few days of playing with it, this is the current result.

Continue reading...