Ride Type Statistics
Or every year in more detail.
Continue reading...
Or every year in more detail.
Continue reading...
Or every year in more detail.
Continue reading...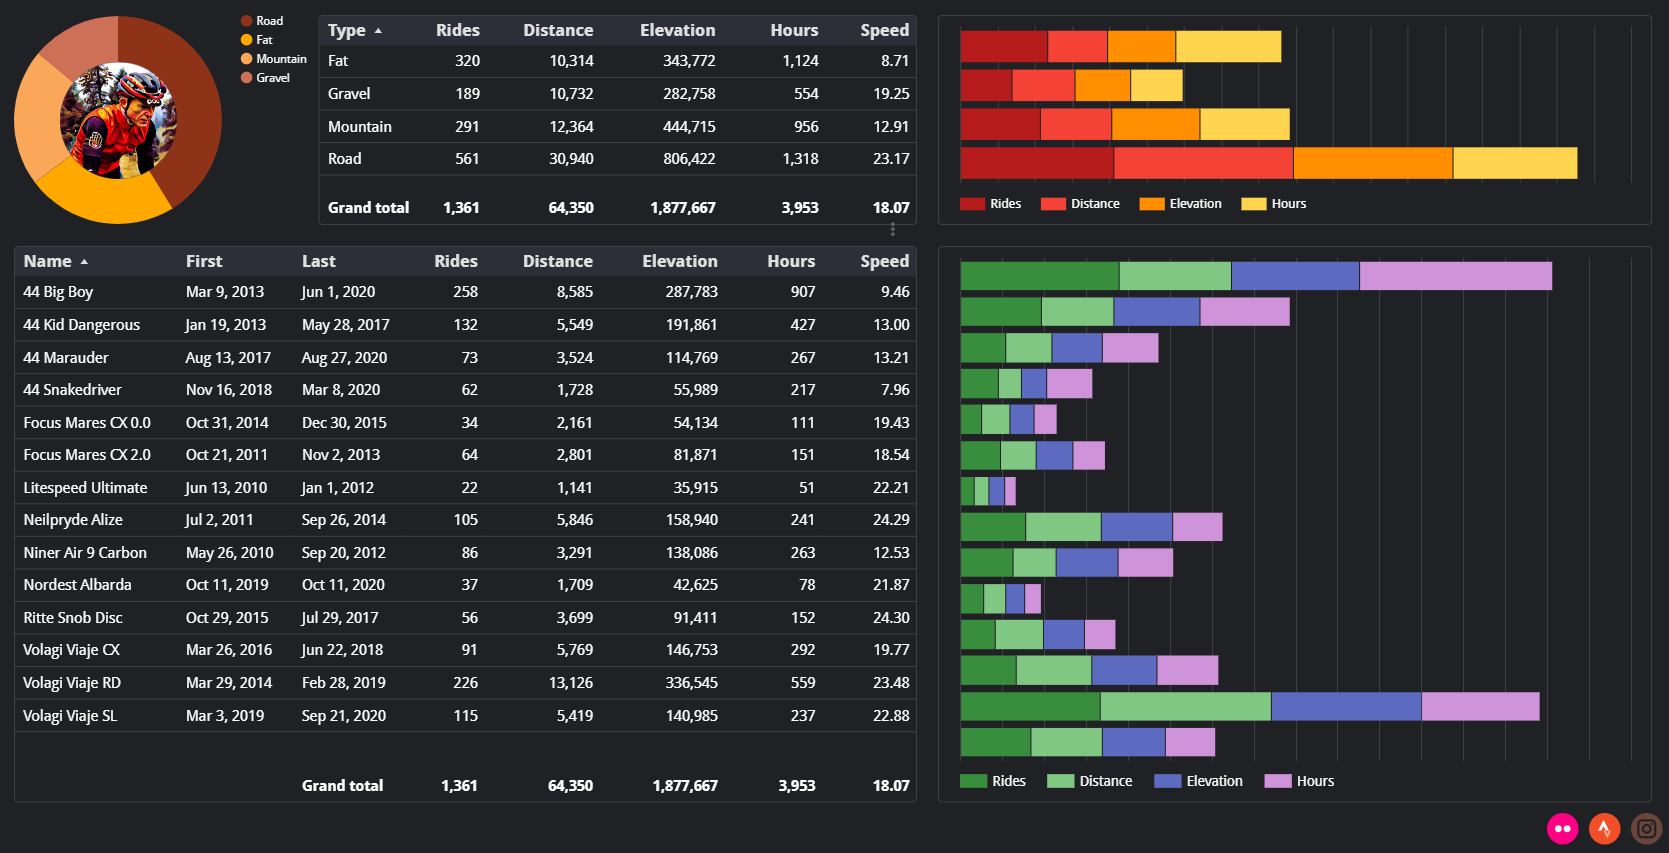
I've been using the flink.run app to add my Strava data to a Google sheet with a bunch of additional tables that crunch the numbers. Each time I add an activity to Strava, flink.run adds a new row to the data table in my Google sheet. The stats in all the other calculated tables are therefore always up to date.
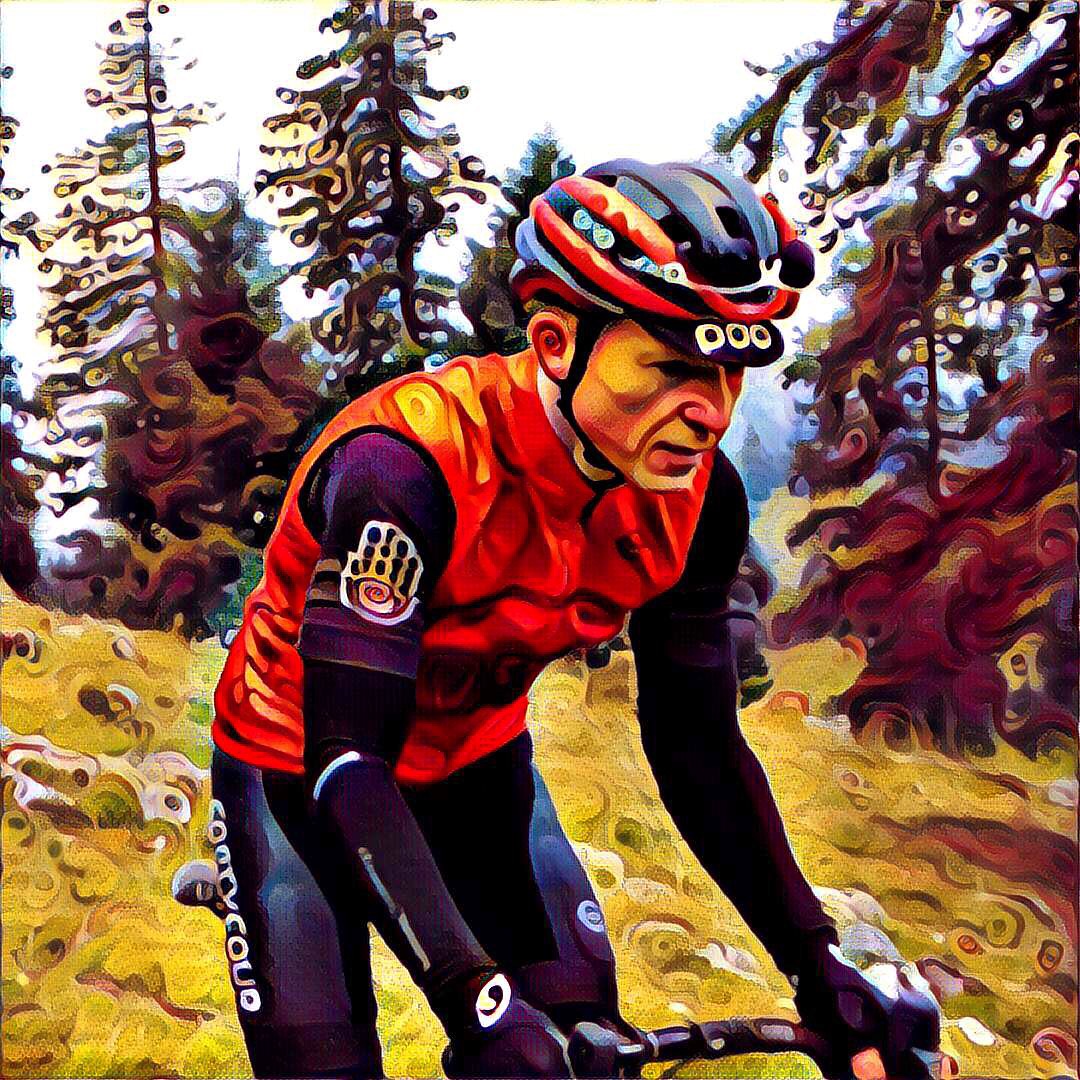
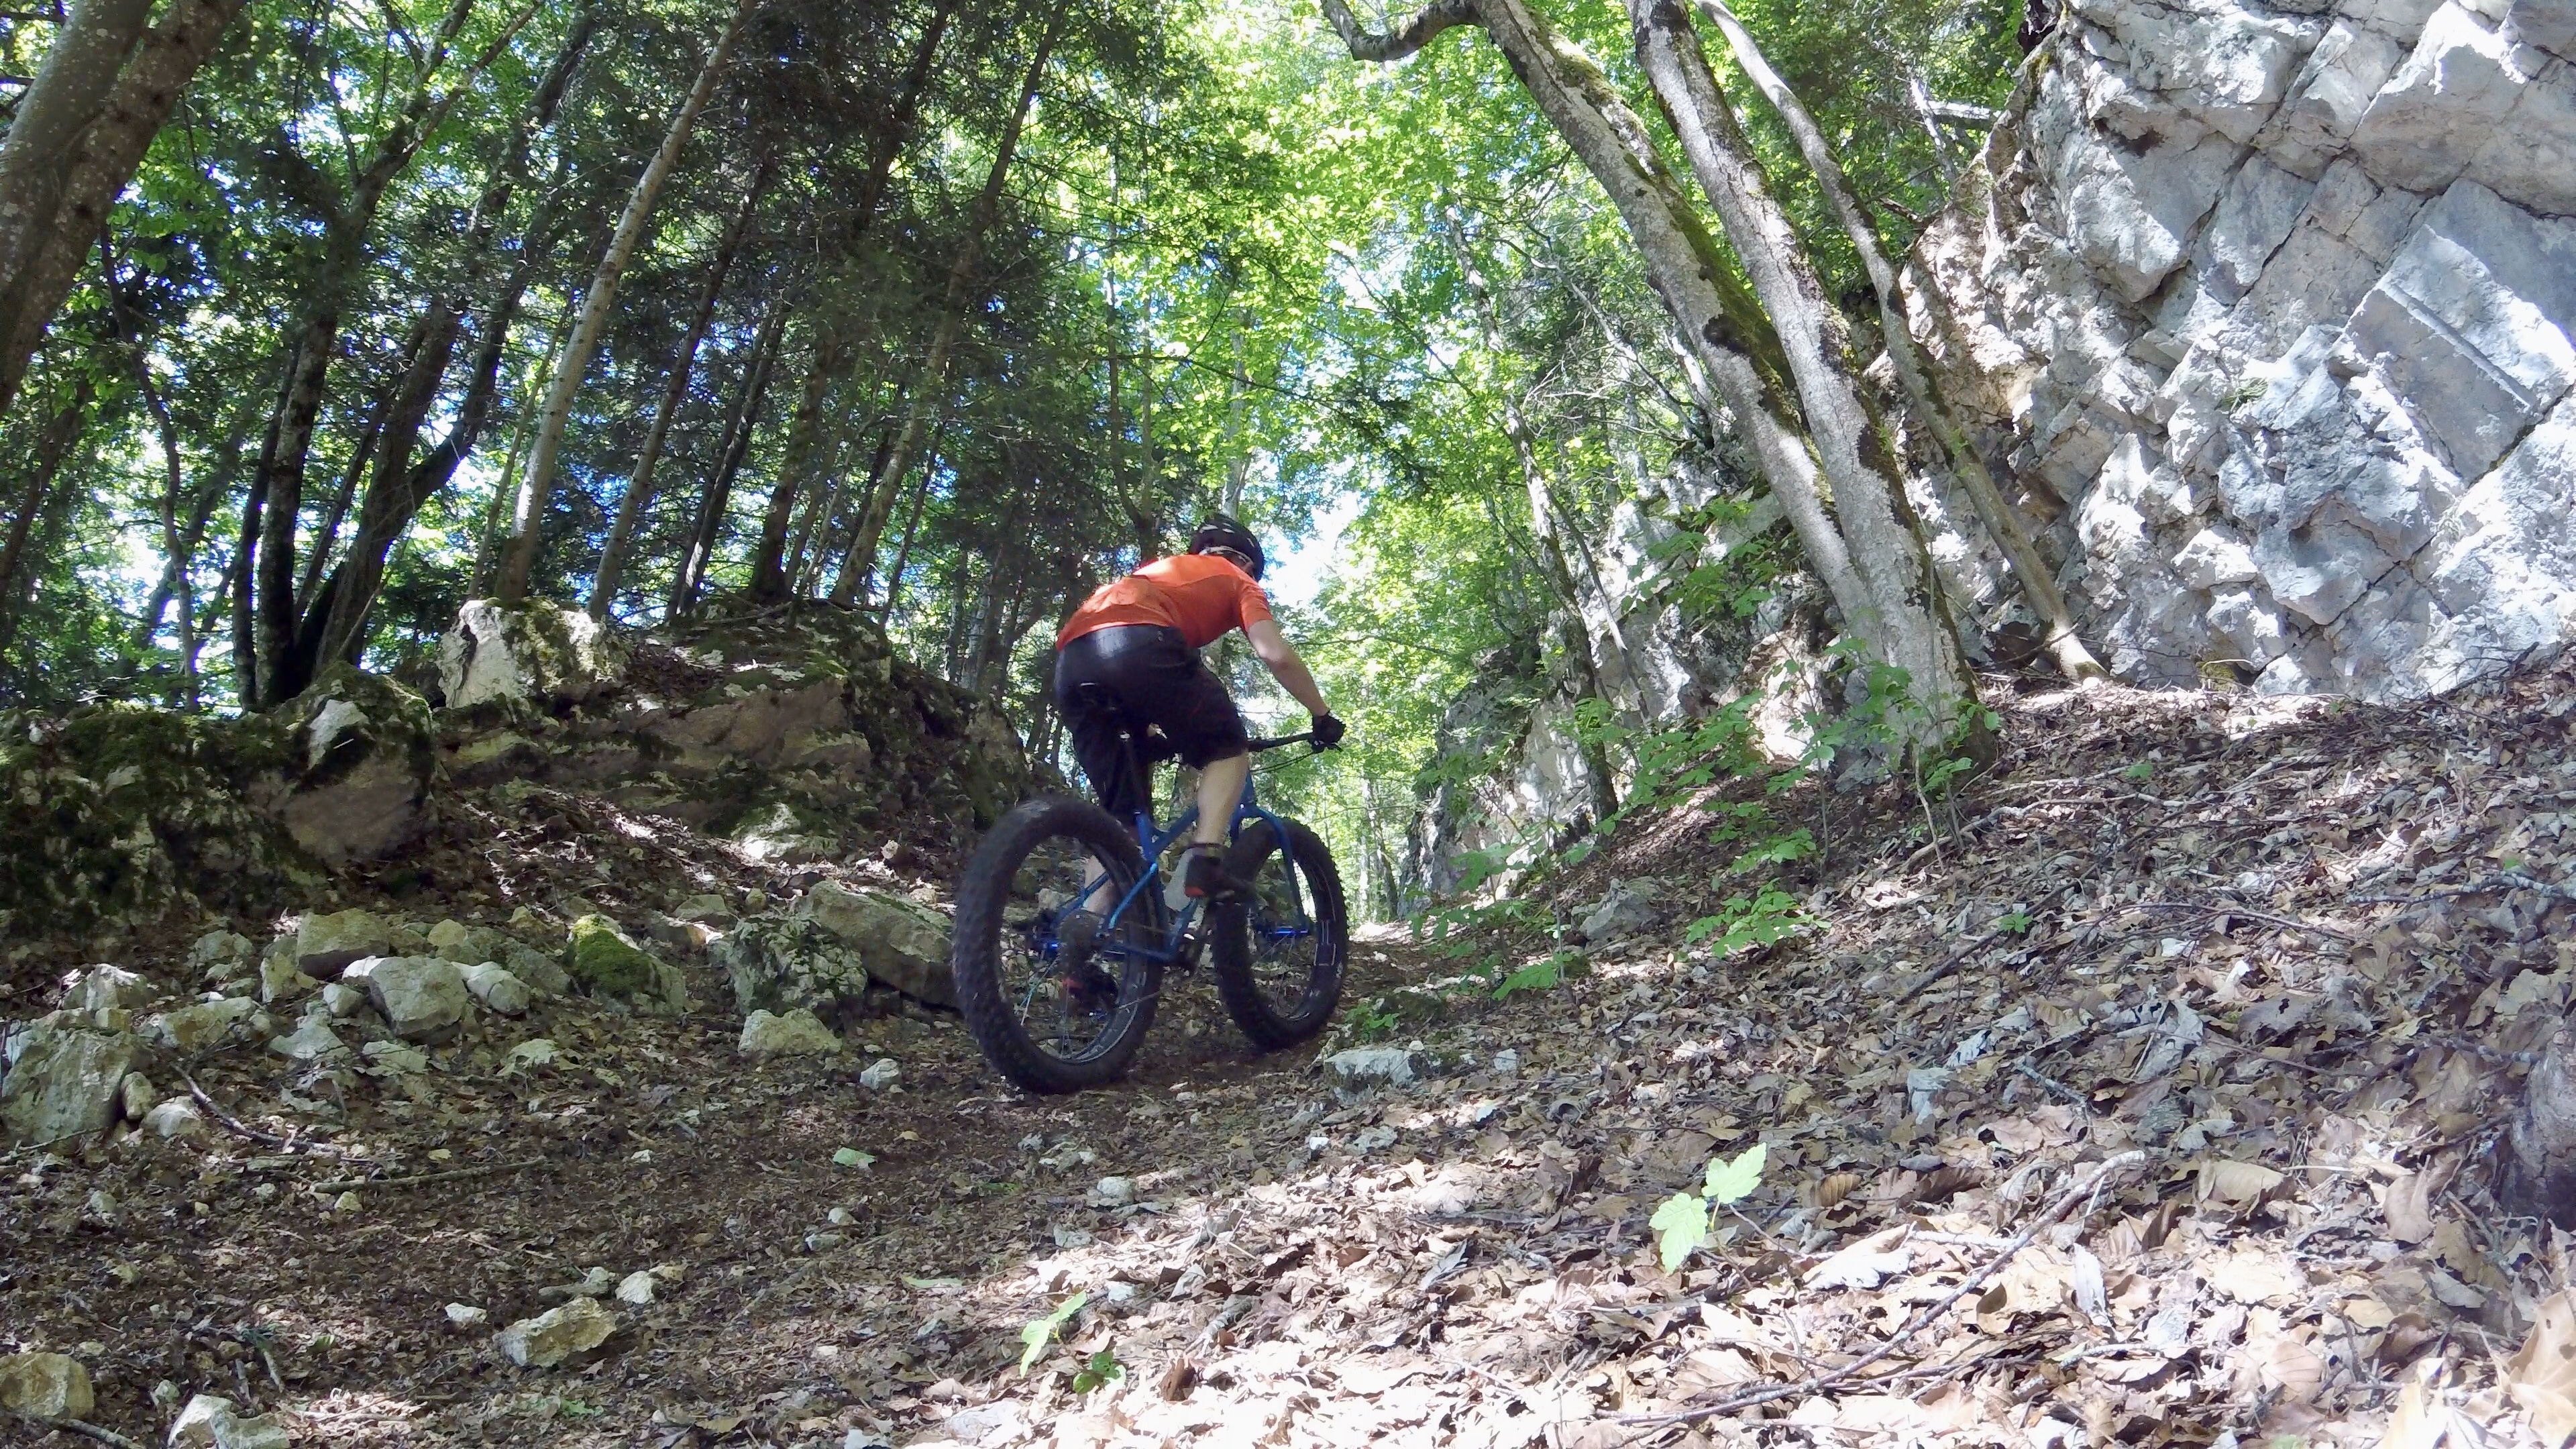
I sent my FortyFour Big Boy fat bike into retirement and wanted to look up my first ride on it. On Strava there's no easy way to find the first activity with a specific gear. In my Google sheet, it's a simple formula to look for the first occurrence of a specific gear within the activity table. Since I was at it, I added a first ride and last ride column to my gear table.
Continue reading...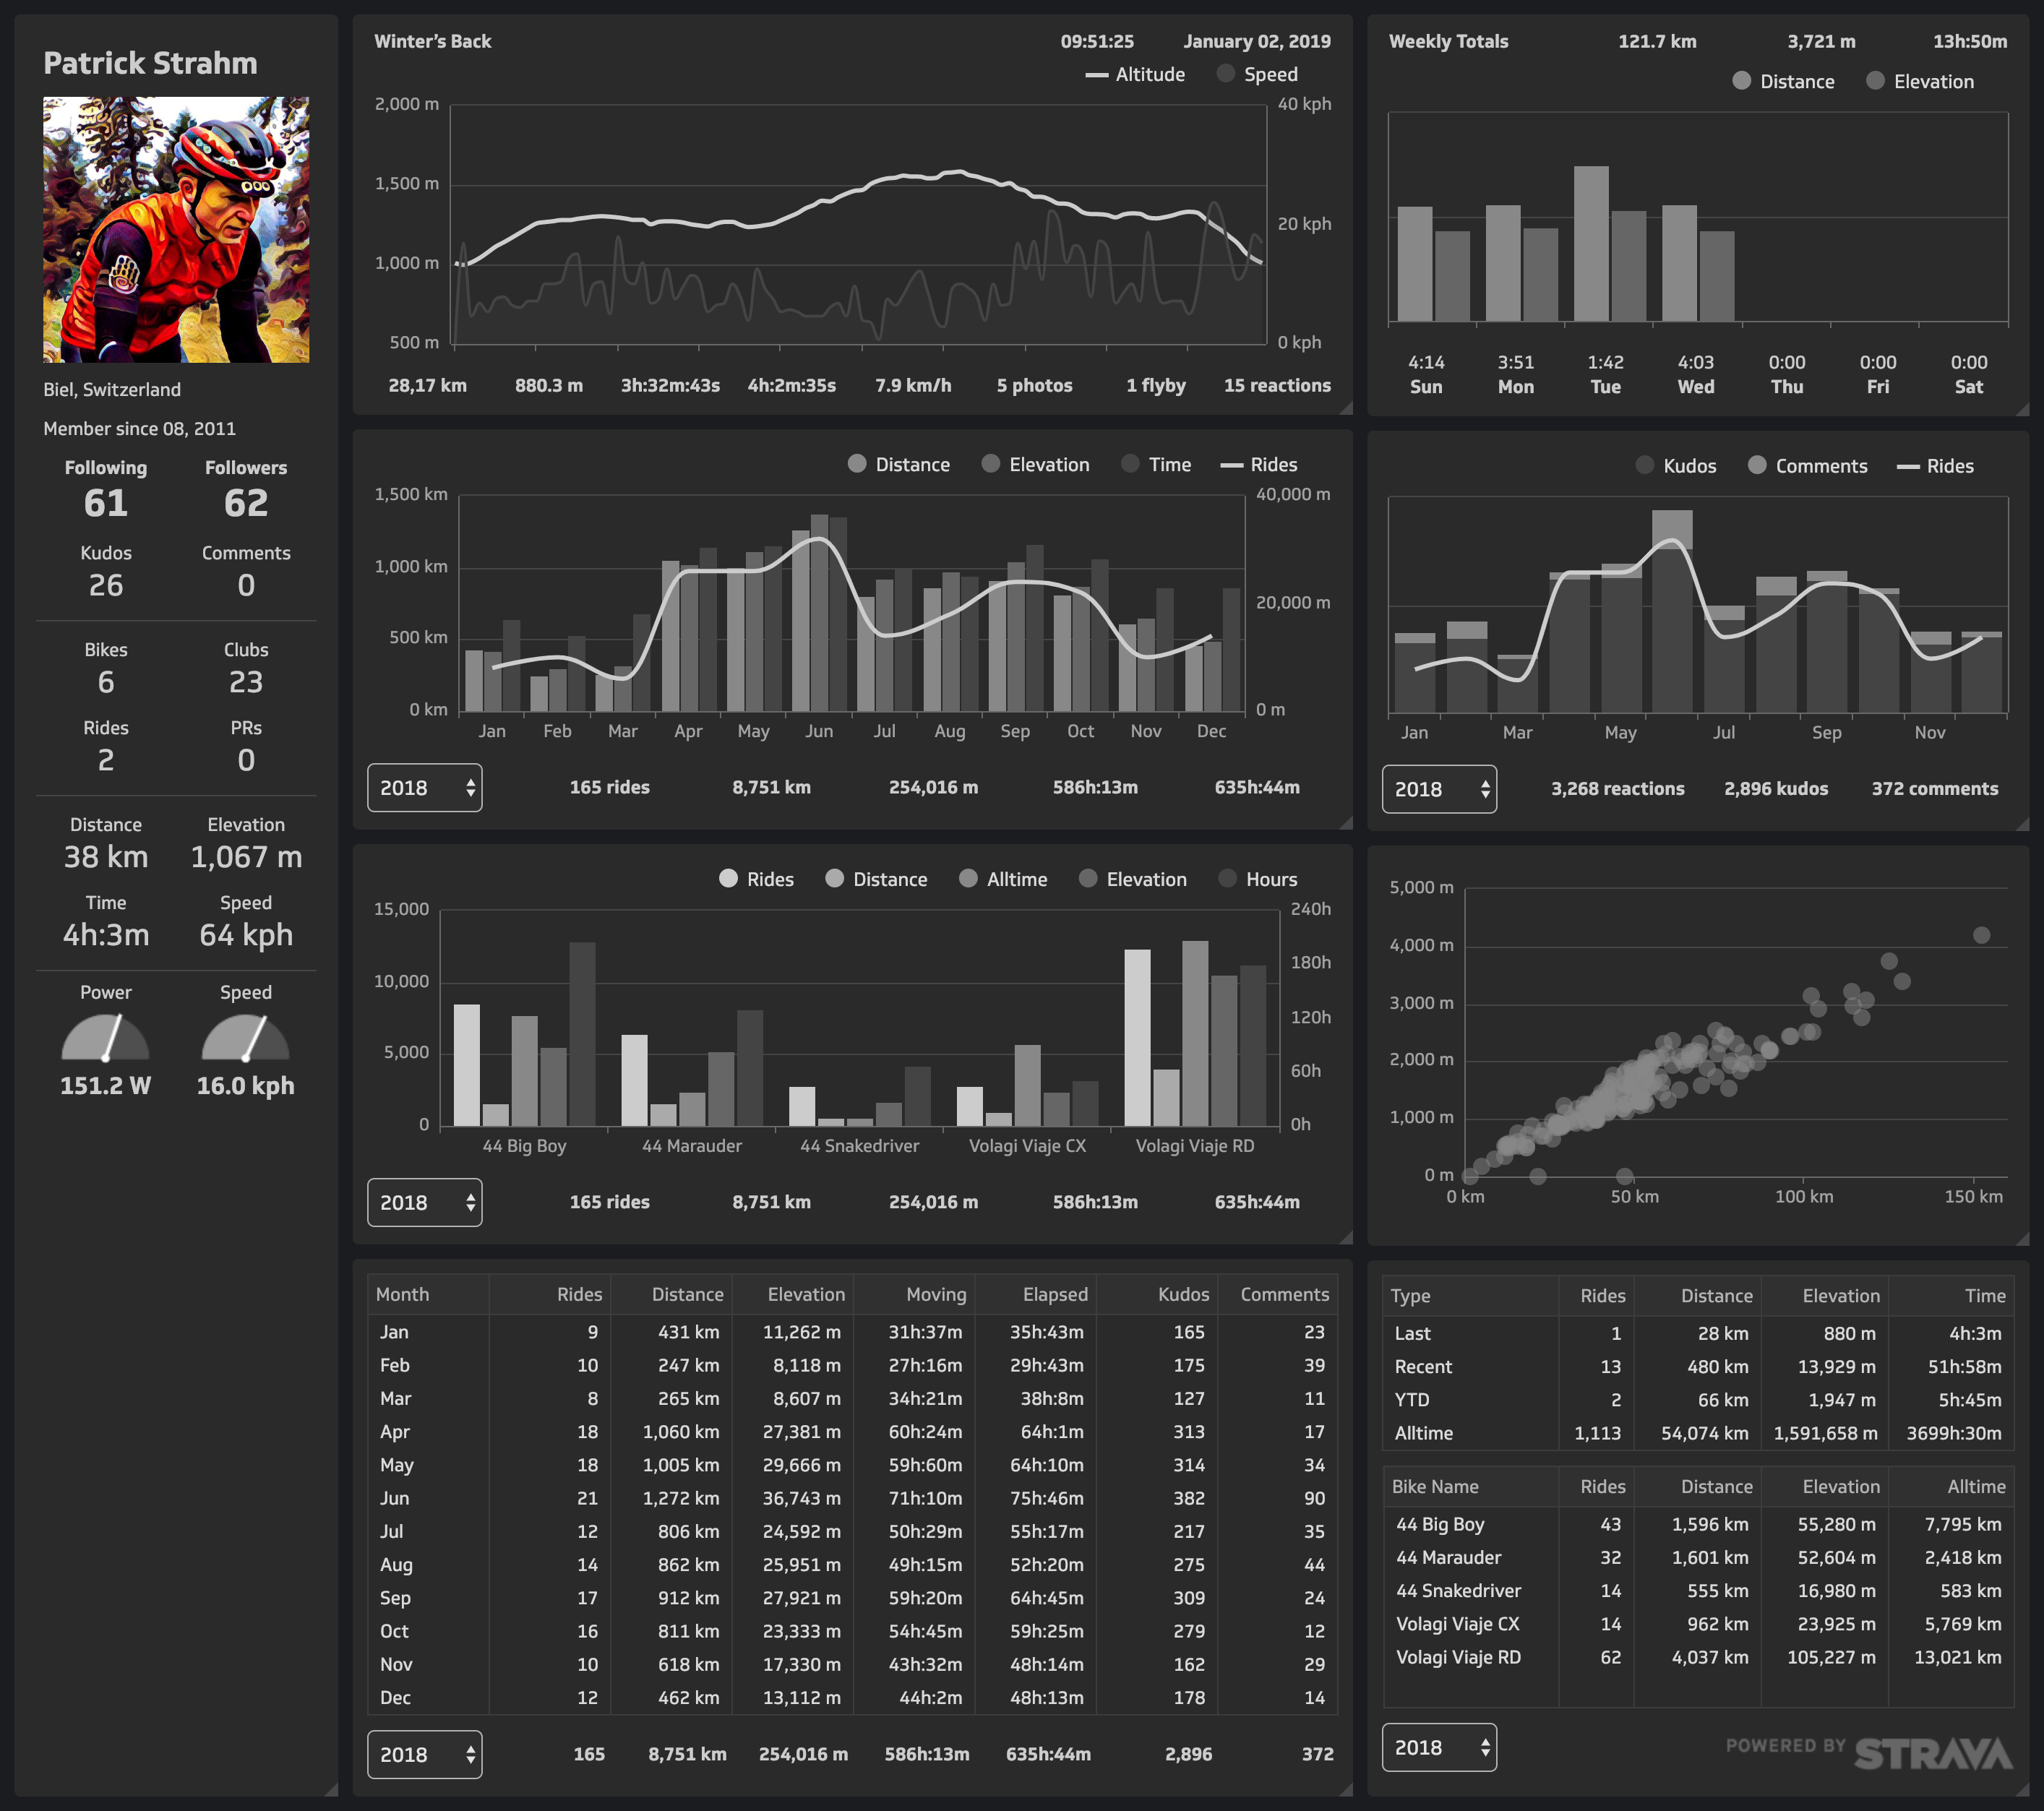
I joined Strava in August of 2011 and have been using it ever since. I don't dig into the numbers much, nor do I ride with any particular goals. Cycling is mainly a way to stay in shape, enjoy the outdoors and have fun. Strava just offers a social connection with like-minded athletes all over the world. It's a great way to stay in touch with people I've ridden and a great place to make new connections. Besides the social aspect of the site, it's also a great activity journal. Based on the data Strava collects, I've maintained the following separate cycling statistics: